Economy History
Before World War 2, Brazil was symbolized using six dominant cycles, each one revolved on one export particular commodity such as, Brazilian wood, livestock, sugar, gold, rubber, and coffee. As each of these cycles reached their height Brazil led the world in production of that commodity. As the mid-1960s inflation began to rise as well as wages increasing at a higher rate than productivity. While expansion of credit to private enterprises decreased. From the years of 1968 to 1973, GDP growth averaged for more than eleven percent annually and from 1974 to 1980 the Brazilian economy slowed down to about an annual growth rate of six percent. These changes were mainly due to the fact of increased cost of imported oil. Industrial products were a big reason for the large change in GDP. The Brazilian Economy then collapsed at about 1990 as GDP fell to four percent. Although, at the same time inflation reached an all time high with 2,938 percent. Inflation continued to grow in the 1990s. For example, in 1994 inflation was at 2,700 percent. That same year a new currency, the real, and a new economic plan called the Real Plan was exposed. At 1997, Inflation dropped to 6.9 percent and since then it has remained in single digits. Real GDP is estimated to have grown 1.5 percent in 2002, while inflation increased to 8.4 percent. As years had past, Brazil has improved greatly but significant vulnerabilities sill remain. It grew approximately 2.3% in 2005 and 4.9% in 2004. These growth records came from high exports, healthy external accounts, moderate inflation, decreasing unemployment, and reductions in the debt-to-GDP ratio. Also in 2004 and 2005, personal incomes improved after a significant decline during the previous decade. Overall, Brazil is still growing as a country and an economy.
GDP: 2014 (third quarter)
The Gross Domestic Product of 2014 in the third quarter has increased 0.1% over the prior quarters. This has been an improvement in domestic demand. As investment went from a 5.2% contraction in quarter two to a 1.3% growth in quarter three. Also, government consumption went up 1.3% in the third quarter which outlooks quarter two's 0.5% decrease. The Central Bank expected GDP to rise 0.7% for 2014 and accelerate that to a 1.2% expansion in 2015.
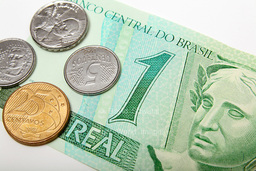
Monetary Unit : Real (BRL) (R$)
 http://cdn.c.photoshelter.com/img-get/I/8677Currency.jpg
The official monetary unit of Brazil is known as real (BRL). Real is the standard national currency used in all twenty six states located in Brazil. It is used for private and commercial commerce. All the currency is managed by the Central Bank of Brazil or in Portuguese Banco Central do Brasil. However, real comes in both the style of paper and coin, as the value different. The coins come in one, two, five, ten, twenty five, fifty, and one-real coins. As said in Portuguese "centavos" means cents. These coins are either carved into the design of the Effigy of the Republic, or with a national historical figure. The paper figure have a design of the Effigy of the Republic with a variant image of indigenous wildlife on the reverse. On the other hand, in English the meaning of the Portuguese word "real" is real or royal. The plural for of real is reais. One dollar equals a hundred cents for example, 1 real = 100 centavos.
Balance of Trade
The Balance of Trade unit in Brazil is USD Million, as the frequency is monthly. In December of 2014, Brazil Recorded a trade surplus of 293 USD Million. From 1959 until 2014 balance of trade in Brazil was at an average of 645.34 USD Million. In July 2006, Brazil reached an all time high of 5659.37 USD Million. As they had an all time low of -4058.14 USD Million in January of 2014. In December, surplus narrowed 89 percent to USD 293 million compared to the same month a year earlier. The imports went down to 9.8 percent to USD 17.20 billion, as exports fell to 19.9 percent to USD 17.49 billion. These are the lowest records since February 2013. Brazil records trade surpluses with Netherlands, China, Argentina, Belgium and Colombia. Ministério do Desenvolvimento, Indústria e Comércio Exterior is where the Balance of Trade in Brazil is recorded.
|
|
|
1.) China (17%)
2.)United States (11%) 3.) Argentina (7.2%) 4.) Netherlands (5.4%) 5.) Germany (3.9%) |
|
1. Refined Petroleum(7.3%)
2. Crude Petroleum(5.7%) 3. Cars(4.3%) 4. Vehicle Parts(3.1%) 5. Petroleum Gas(2.7%) 6. Integrated Circuits(1.9%) 7.Packaged Medicaments(1.6%) 8. Telephones (1.6%) |
|
1.) China (15%)
|
Major Natural Resources
-Bauxite
-Gold
-Iron Ore
-Manganese
-Nickel
-Phosphates
-Platinum
-Tin
-Rare earth elements
-Uranium
-Petroleum
-Hydropower
-Timber
-Gold
-Iron Ore
-Manganese
-Nickel
-Phosphates
-Platinum
-Tin
-Rare earth elements
-Uranium
-Petroleum
-Hydropower
-Timber
Economic Sectors
Just as Brazil has one of the largest economies in the world, it has well-developing agricultural, mining, manufacturing, and service sectors. About one fifth of the workforce in Brazil is based on agriculture as it has immense agricultural resources. The main commercial crops are coffee, citrus fruit, soybeans, wheat, rice, corn, sugarcane, cocoa, cotton, tobacco, and bananas. Brazil is also a main exporter of coffee, soybeans, beef, sugar cane, ethanol and frozen chickens. There are two main agriculture areas such as Southern and Northern Brazil. Manufacturing in Brazil is also very important as manufacturing occurs in the production of textiles and clothing, footwear, food, and beverages. Machinery and transport equipment, construction materials, sugar cane and wood derivatives, and chemicals are also used as important manufacturing industries in the country. On the other hand, there is mining as Brazil is the largest producer of bauxite, gemstones, columbium, gold, iron ore, kaolin, manganese, tantalum, and tin. Their major exports are iron ore, tin, and aluminum. The largest service industry in Brazil is the financial sector, which is mainly owned by the government. These sectors are still growing processes in the world today.
Stock Exchange
The IBOVESPA is a major stock market index that tracks down the liquid stocks traded on the Sao Paulo Stock Exchange in Brazil. The Brazil Stock Market has decreased to 47645.87 index points in January from 50007.41 index points in December 2014. Brazil has averaged 15409.63 index points from 1989 until 2015, reaching an all time high of 73153 Index points in May 2008 and an all time low of 0.01 index points in December 1989.
Banking System
The Banking System of Brazil is basically made up of two factors one being the domestic institutions (49.06%) and the other domestic with foreign ownership (35.22%). In the very Banking System it is very important that Brazilian credit resiliency is supported by a
credit mix, spread out in diverse domestic financing sources, provided money by
local-currency deposits, domestic fixed income corporate securities and low mortgage securities exposure.
Taxation Policy
Corporate Taxes: Residential companies in Brazil must pay taxes on their worldwide profit. If it is a foreign company, they are only taxed if they are involved in any with companies or agents that are residents in Brazil.
Individual Taxes: Residents in Brazil who have a visa or a local work contract are taxed on their worldwide income. Although, if there is a bilateral agreement on double taxation then it is different. Non-residents are liable for a 27.5% tax on their wages earned in Brazil and 15% on their other income.
Individual Taxes: Residents in Brazil who have a visa or a local work contract are taxed on their worldwide income. Although, if there is a bilateral agreement on double taxation then it is different. Non-residents are liable for a 27.5% tax on their wages earned in Brazil and 15% on their other income.
Photo used under Creative Commons from George Vale
